Higher Resolution U.S. Flood Maps
Apr 24, 2022 | Source: gislounge.com


Flooding is, by nature, an uneven hazard that affects regions disproportionately. More than just geographic variability such as as proximity to low lying floodplains or major rivers, flooding is also likely to disproportionately affect the poor who live in the most vulnerable places.
In a new study and map of the United States showing flood risk, it is clear that the poorest are likely to feel the effects of devastating flooding exacerbated by climate change in the next few decades.
Currently, most flood risk estimates are undertaken across the United States using flood maps with relatively coarse elevation data and climate information that uses past data.
These estimates do not capture risk faced by individual homes or even small-scale neighborhoods, while they fail to incorporate future climate change scenarios. In the United States, maps available from the Federal Emergency Management Agency (FEMA) are a standard way for insurance companies to estimate flood risk.[1]
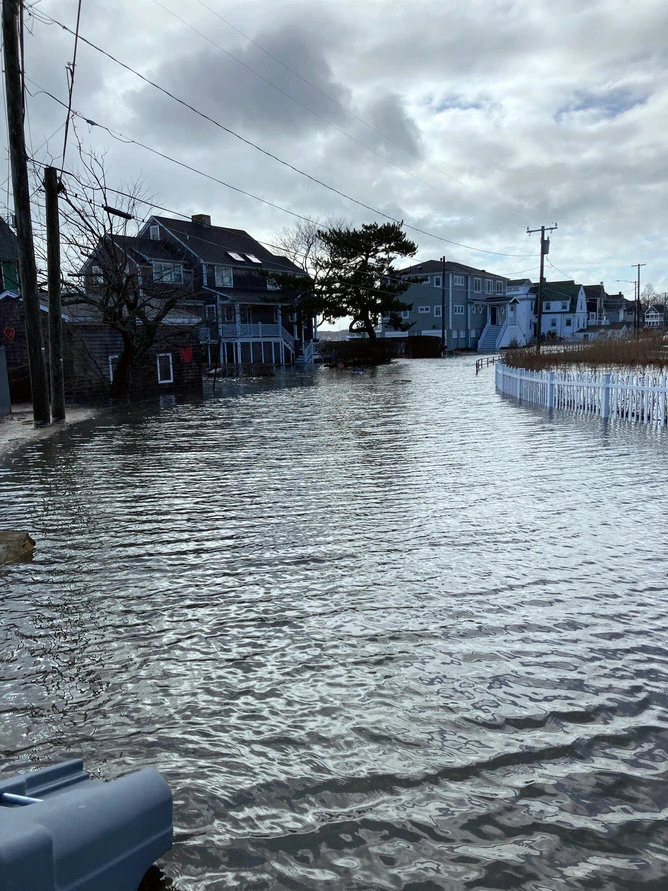
Street flooding at high tide during a storm event on January 17, 2022, at Crescent Beach in Niantic, Connecticut. Photo: Timothy C. Sargent, USGS, public domain.
The reality is fine-scale maps that portray flood risk for individual homes will be needed if we are to prepare and know how communities are likely to be impacted under different climate change scenarios.
By 2050, it is estimated that about 40 billion USD of annual flood losses could occur in the United States due to high flooding. For every 1 degree Celsius increase in global temperatures, it is estimated that there is a 7% increase in atmospheric moisture.
All of this points to future decades of substantially increased rainfall and storm surges in parts of the United States.
Areas that are vulnerable in the United States include coastal Louisiana, Appalachia, the inland Northeast, rural counties of the Pacific Northwest, and Northern California.
Researchers, using a highly parallel model run on a spatial resolution of about 20–30 m grid intervals across the entire US, have been able to develop for the first time a high resolution flood risk map. Additionally, river channels are incorporated but decoupled from the larger model, where channels less than the 20-30 m grid size are incorporated in hydrologic discharge.
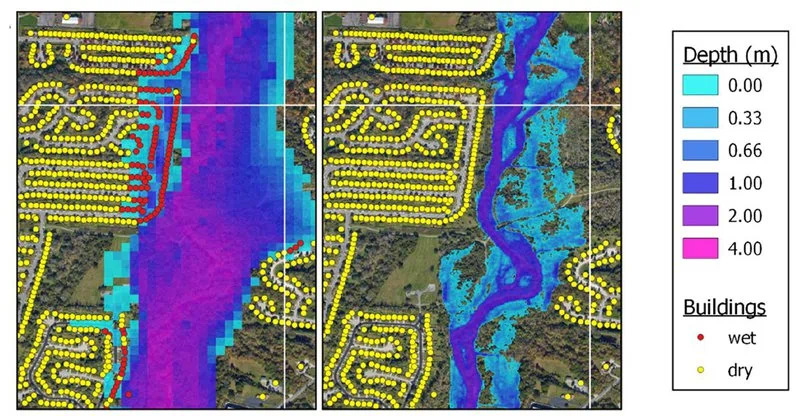
The map on the left shows flood risk from FEMA’s National Flood Map program. The map on the right is the new higher-resolution flood map model from Bates et al., 2020, CC BY 4.0.
The model incorporates different climate scenarios, in addition to also using current climate condition, with the baseline being reduction of total greenhouse emissions beginning in 2040 in estimating temperature rise over the coming decades.[2]
Climate scenarios from 2020 to 2050 were estimated using global circulation models, with hurricanes also factored for their potential effects in storm surges and rainfall. Coastal models of changing sea levels and surges, as well as incorporating coastal protection measures currently in place, were included.
Overall, the results allowed, for the first time, a fine-scale model of flood risks to be mapped across the entire United States in 20-30 m resolution.
The incorporation of demographic and residential data also allows the map to be useful for current and future risk estimates down to residential scales. The National Structure Inventory (NSI) data set was also used to assess all buildings in the United States that can be represented as a points to assess their potential for flood risk.
This enables the model to look at fine-scale damage down to the the building level.[3]
Flooding is the most costly natural disaster in the United States. Now that a detailed map can be created for flood potential, floods can be effectively measured at different time and spatial scales, with small-scale and large-scale floods estimated.
Using the building and demographic data in the new flood maps, it is clear that impoverished regions will face the majority of increased flood risks in the coming decades. These areas are in low-lying regions such as the coasts or Appalachia, which will likely face increased storm surges and heavier rainfall.
More economically vulnerable regions often recover more slowly and have relatively poor infrastructure to deal with flooding, such as efficient drainage systems or coastal barriers.[4]
Interestingly, earlier research has shown that it may simply be cheaper, at least in a third of currently undeveloped floodplain areas, to buy land at current land prices and use the land for wildlife and recreation rather than convert them into homes.
This also raises the question on the ethics of building in flood-prone regions, which may be relatively cheaper land for developers, now that we know the likely risks involved in coming decades.[5]
With increased climate change, the likelihood is many regions will face increased natural threats with flooding being among the most common. Large areas of the United States are categorized as having a high risk for major flooding episodes in the next few decades.
In particular, poorer communities, which also have the least prepared infrastructure, will face the brunt of these threats. This raises a variety of social, ethical, and economic questions for these communities and policy in general.
While these questions will undoubtedly be complex to resolve for policymakers, we now have the ability to at least better estimate flood hazards and risk in much greater detail down to individual home or neighborhood levels. This does at least give individuals an important tool to make decision on where they may want to live in the coming decades.
[1] For more on FEMA maps, see: https://msc.fema.gov/portal/home.
[2] The model that can deploy a new fine-scale hydrologic estimate for the entire United States is described here: Bates, P.D.; Quinn, N.; Sampson, C.; Smith, A.; Wing, O.; Sosa, J.; Savage, J.; Olcese, G.; Neal, J.; Schumann, G.; et al. Combined Modeling of US Fluvial, Pluvial, and Coastal Flood Hazard Under Current and Future Climates. Water Res. 2021, 57, doi:10.1029/2020WR028673..
[3] Results from the new flood model for the United States can be seen here: Wing, O.E.J.; Lehman, W.; Bates, P.D.; Sampson, C.C.; Quinn, N.; Smith, A.M.; Neal, J.C.; Porter, J.R.; Kousky, C. Inequitable Patterns of US Flood Risk in the Anthropocene. Nat. Clim. Chang. 2022, doi:10.1038/s41558-021-01265-6.
[4] For more on the inequality of flooding on communities, see: https://theconversation.com/new-flood-maps-show-us-damage-rising-26-in-next-30-years-due-to-climate-change-alone-and-the-inequity-is-stark-175958.
[5] For more on the costs of land and its use relative to flood damage likelihood for the United States, see: Johnson, K.A.; Wing, O.E.J.; Bates, P.D.; Fargione, J.; Kroeger, T.; Larson, W.D.; Sampson, C.C.; Smith, A.M. A Benefit–Cost Analysis of Floodplain Land Acquisition for US Flood Damage Reduction. Nat Sustain 2020, 3, 56–62, doi:10.1038/s41893-019-0437-5.